Here we'll dive into some of the API audio properties and show you the basics of audio visualizer creation. Most visualizers are built from the same set of basic principles, so a little bit of practice can produce some very fun results.
SignalRGB Audio Properties
The audio data provided by SignalRGB can be accessed through a few properties in your code:
- engine.audio.level - returns a number between -100 and 0 representing the overall loudness of the track. 0 is loud, -100 is very low.
- engine.audio.density - returns a number between 0 and 1 representing the roughness of the tone, with test tones returning 0 and white noise 1.
- engine.audio.freq - returns an array of 200 elements containing the track's frequency data.
Each property will require different levels of normalization or adjustment before it can be properly utilized, which I will get into in a bit.
Let's start with basic frequency animation.
Frequency
Frequency represents the pitch of the sound we hear and is the most important property for audio visualizers. What we're doing here is taking 200 slices of the frequency wave each frame and converting it to visual form. The basic process is:
- Instantiate an array and fill it with the frequency data.
- Edit this array to suit your needs (filter, map, reduce, etc.).
- Write a "sound bar" class to represent each element.
- Connect the data to the sound bar class each frame.
The important part with frequency is that we'll have to make two adjustments to the raw data. Sometimes an element will come in with a negative value, which is visually jarring. The height of the elements also comes in incorrectly for this example. Since positive values in a rectangle's "height" option draw down from the shape's origin, we'll want to flip these to resemble your average visualizer.
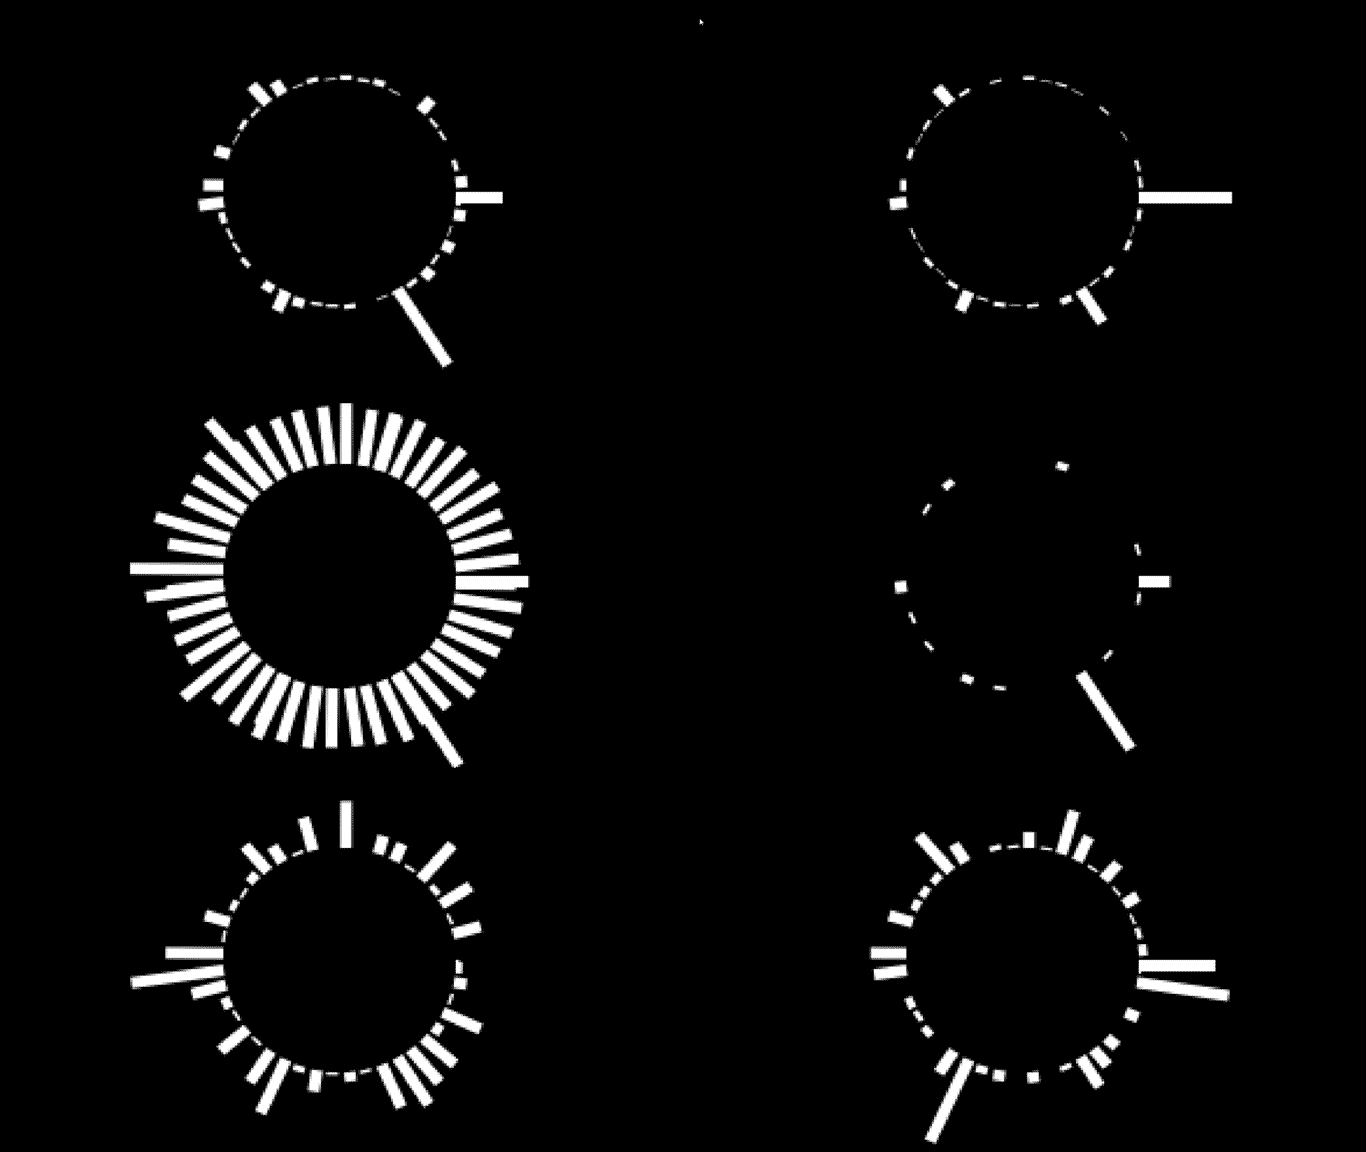
Example - unprocessed data:

Processed data:

Code example with processed data:
<head> <title>Visualizer Tutorial</title> <meta description="Basic Effects" /> <meta publisher="SignalRgb" /> </head> <body style="margin: 0; padding: 0; background: #000;"> <canvas id="exCanvas" width="320" height="200"></canvas> </body> <script> canvas = document.getElementById('exCanvas'); ctx = canvas.getContext('2d'); var effects = []; var reducedFreq = []; function update() { // "frequency" represents the full 200 elements from our frequency data var frequency = new Int8Array(engine.audio.freq) // "reducedFreq" filters the data down to every fourth result to save some CPU load reducedFreq = frequency.filter((element, index) => { return index % 4 === 0; }) // Create the effect if it does not yet exist if(effects.length < 1){ effects.push(new soundBars(20, 100)) } // Background color DrawRect(0, 0, 320, 200, "black") // Play effect effects.forEach((ele, i) => { ele.draw(); if (ele.lifetime <= 0) { effects.splice(i, 1); } }); window.requestAnimationFrame(update); } function soundBars (x, y){ this.x = x; this.y = y; this.draw = function(){ for(let i = 0; i < reducedFreq.length; i++){ var x = this.x + 5 * i var y = this.y // Data processing occurs for "height". Find the absolute value of each element, then flip negative var height = -Math.abs(reducedFreq[i]) DrawRect(x, y, 5, height, "white") } } } function DrawRect(x, y, width, height, color) { ctx.beginPath(); ctx.fillStyle = color; ctx.fillRect(x, y, width, height); }; window.requestAnimationFrame(update); </script>There are still some issues with the above visualizer, however. Although the song sounds well-rounded through our earphones, we can see that the data massively favors some of our sound bars and often leaves others completely invisible. From an artistic perspective, this isn't ideal, so we're going to "normalize" the data received from SignalRGB. Normalization involves evenly distributing data between a maximum and minimum point in order to better illustrate their value in relation to one another. After figuring out our maximum and minimum values in the frequency array, the equation is pretty simple overall: (x - min) / (max - min), where "x" represents the current element.
Normalized, processed data:

Next up, we'll add a little pizzazz by arranging the sound bars in a circle:
function soundBars (x, y){ this.x = x; this.y = y; this.draw = function(){ var max = Math.max(reducedFreq) var min = Math.min(reducedFreq) for(let i = 0; i < reducedFreq.length; i++){ //Save the current state of the canvas ctx.save() //Add the circular component to your bars. "50" here is the radius of the circle var x = this.x + Math.cos(i) * 50 var y = this.y + Math.sin(i) * 50 var height = ((Math.abs(reducedFreq[i])) - min) / (max - min) * -40 // Determine the angle of the bar, to make it perpindicular to the circle var rotate = Math.atan2(y - this.y, x - this.x) + Math.PI / 2; //Translate to circle center ctx.translate(x, y) //Rotate the canvas ctx.rotate(rotate) //Translate back for drawing ctx.translate(-x, -y) DrawRect(x, y, 5, height, "white") //Restore the old state of the canvas after drawing to prevent positive feedback loops ctx.restore() } } }
Density
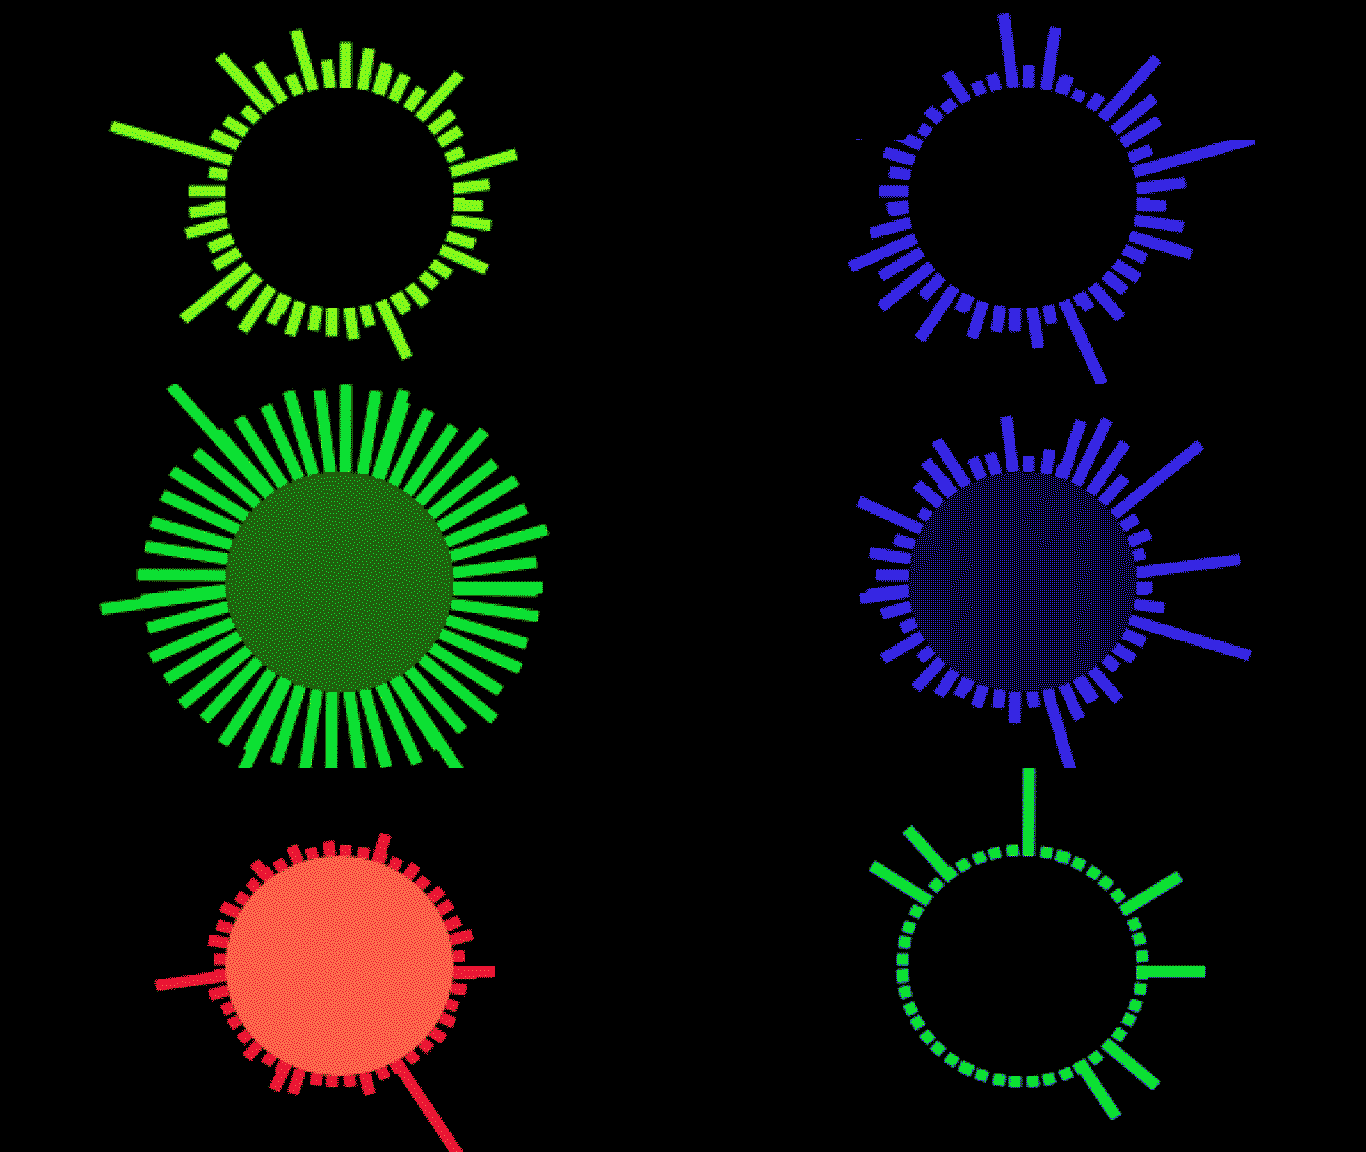
Density is simple to use. The returned value will be a number between 0 and 1 representing the "cleanness" of the tone. Digital tones will be closer to 0, and analog tones will be closer to 1. For this example, I'll use it to edit the color of the sound bars, which will give distinct tones in your song distinct colorings.
function soundBars (x, y){ this.x = x; this.y = y; this.rotate = 0; this.draw = function(){ //Hue is calculated each frame, the resulting amount will be a proper hue option for hsl var hue = engine.audio.density * 360 var max = Math.max(reducedFreq) var min = Math.min(reducedFreq) for(let i = 0; i < reducedFreq.length; i++){ ctx.save() var x = this.x + Math.cos(i) * 50 var y = this.y + Math.sin(i) * 50 //Height slightly edited for visability var height = ((Math.abs(reducedFreq[i])) - min) / (max - min) * -50 - 5 this.rotate = Math.atan2(y - this.y, x - this.x) + Math.PI / 2; ctx.translate(x, y) ctx.rotate(this.rotate) ctx.translate(-x, -y) //Insert the edited hue value each frame DrawRect(x, y, 5, height, `hsl(${hue}, 100%, 50%)`) this.rotate = 0; ctx.restore() } } }
Level
This property simply returns the loudness of the track in decibels, with the trick being that it produces numbers between -100 and 0. -100 is very quiet, and 0 is very loud. We will have to do a little editing of this data to use it the way I want to, and I'll be drawing this shape in our update function. Here, the track level will edit the lightness of the inner black circle.
function update() { var frequency = new Int8Array(engine.audio.freq) reducedFreq = frequency.filter((element, index) => { return index % 4 === 0; }) if(effects.length < 1){ effects.push(new soundBars(160, 100)) } DrawRect(0, 0, 320, 200, "black") effects.forEach((ele, i) => { ele.draw(); if (ele.lifetime <= 0) { effects.splice(i, 1); } }); // Hue calcualtion to match the rest of the visualizer var hue = engine.audio.density * 360 //The level has been multiplied by 10, then added to 100. This is arbitrary, but some combination of actions here will give you the result you want DrawCircle(160, 100, 50, `hsl(${hue}, 100%, ${100 + engine.audio.level * 10}%)`) window.requestAnimationFrame(update); }